
Customer Support
How to enable Windows Defender Firewall logging and interpret log data
Every modern Windows operating system includes the built-in firewall "Windows Defender Firewall". This tool offers a wide range of features, including logging both blocked and successful connections. Surprisingly, these logging options are disabled by default.
This guide will walk you through enabling firewall logging and understanding the log data it generates.
Enabling Windows Defender Firewall Logging
- Step 1 Connect to your Windows Server using Remote Desktop or the VPS console.
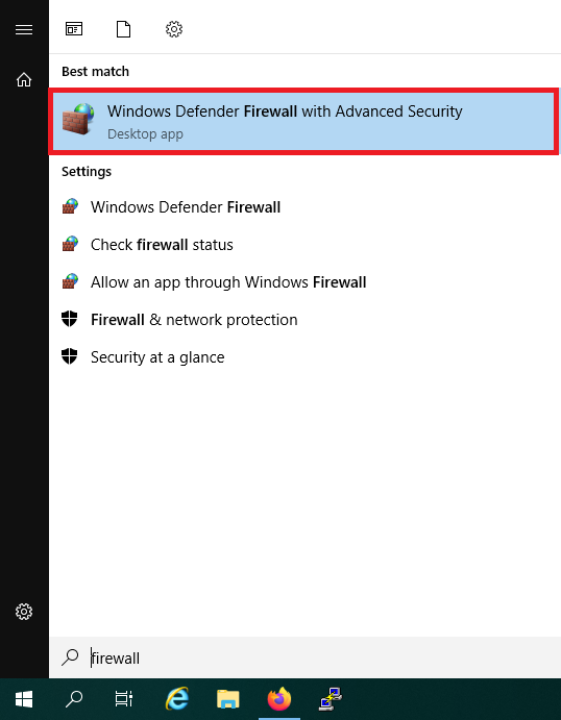
- Step 2 Click the Start button, type firewall, and select Windows Defender Firewall with Advanced Security from the results.
- Step 3 In the Firewall window, click Properties on the right-hand side

- Step 4 In the new window (under the Domain Profile tab), click Customize under the Logging section.

- Step 5 Now configure the following options:
Name: Path where the log file is saved — default is C:\Windows\System32\LogFiles\Firewall\pfirewall.log
Size limit (KB): Default is 4096KB (4MB)
Log dropped packets: Set to Yes
Log successful connections: We recommend leaving this set to No to avoid excessive noise in logs Click OK to save the settings.

- Step 6 Repeat steps 4 and 5 for the Private Profile and Public Profile tabs.
- Step 7 Finally, restart your VPS to ensure proper log functionality. Without a reboot, logs may stop updating due to a conflict with the Base Filtering Engine service.
Interpreting Windows Firewall Log Data
The log file structure is straightforward. Each entry contains several fields such as:
- date: Date of the event
- time: Time of the event
- action: DROP (blocked) or ALLOW (successful)
- protocol: TCP, UDP, or ICMP
- src-ip: Source IP address
- dst-ip: Destination IP address
- src-port: Source port
- dst-port: Destination port
- path: Direction — SEND (outgoing), RECEIVE (incoming), FORWARD, or UNKNOWN
- pid: Process ID associated with the connection
Example log entries:
2022‑10‑21 12:04:12 DROP TCP 123.123.123.123 111.222.333.444 63573 3389 52 S 2140869953 0 8192 - - - RECEIVE 4
2022‑10‑21 12:04:49 ALLOW UDP 111.222.333.444 239.255.255.250 61929 1900 0 - - - - - - - SEND 932
The first entry shows a blocked (DROP) attempt to connect to Remote Desktop port 3389 from IP 123.123.123.123.
The second entry shows a successful outgoing (ALLOW) UDP broadcast to IP 239.255.255.250 — this is usually harmless.
Details like size, TCP flags, and ICMP fields can usually be ignored for standard security reviews.
Focus on action, protocol, src-ip, dst-ip, dst-port, path, and pid for useful insights.
By enabling firewall logging and reviewing key fields, you gain valuable visibility into unwanted or suspicious connections on your VPS.
You haven't found what you are looking for?
Contact our experts, they will be happy to help!
Contact us